Cash Flow
Consolidated Cash Flow
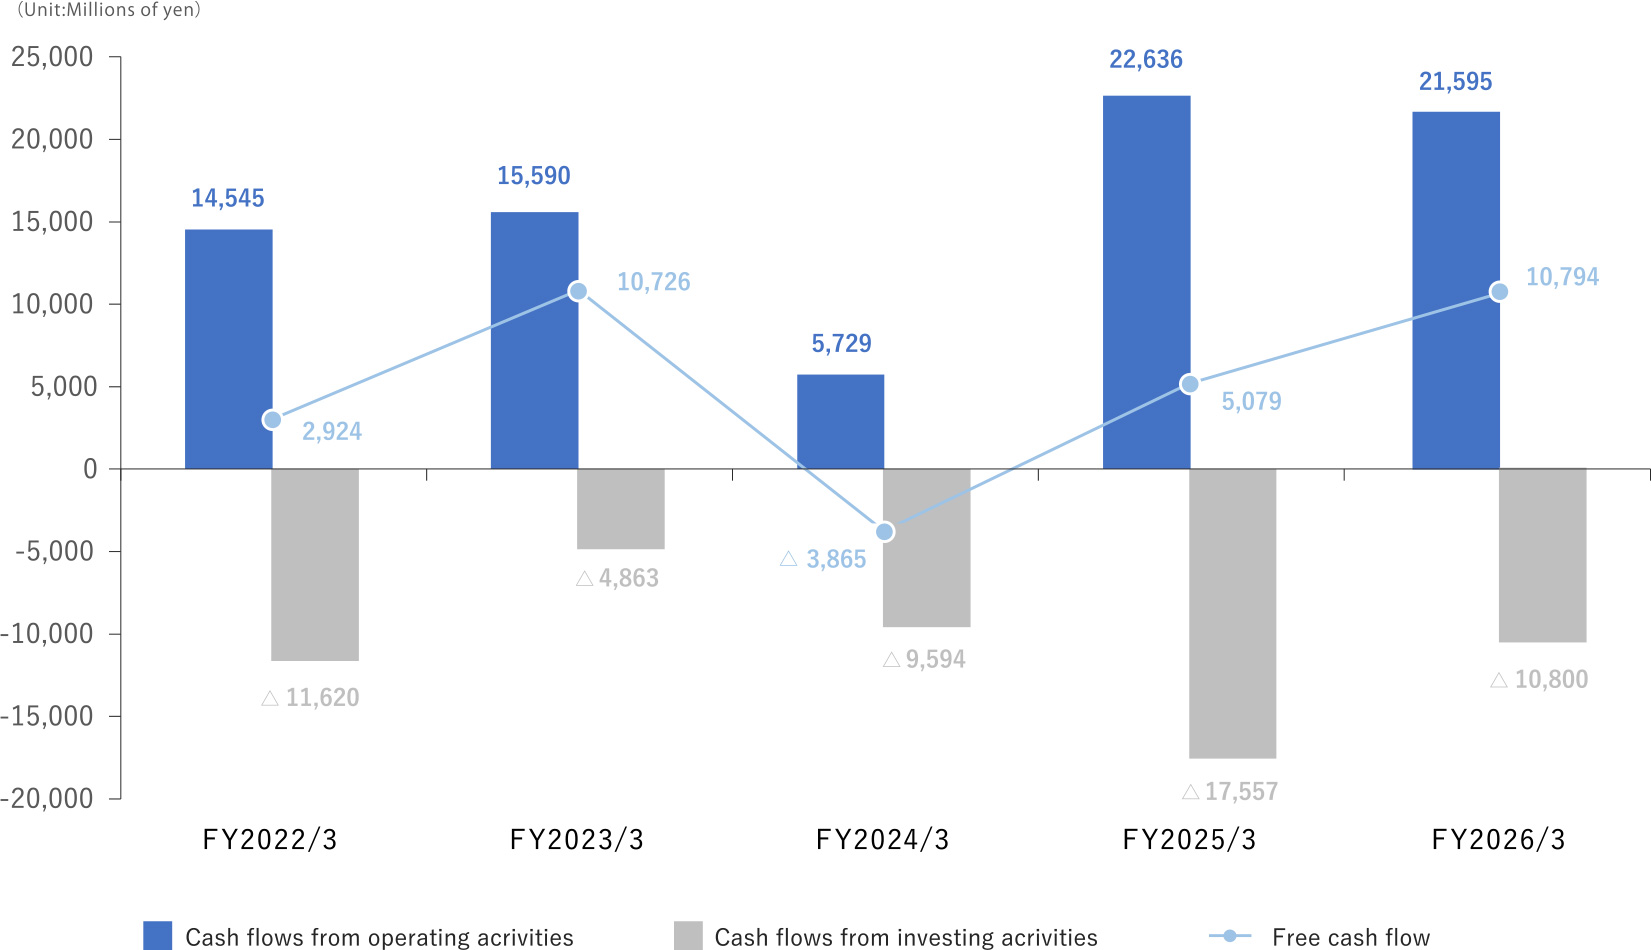
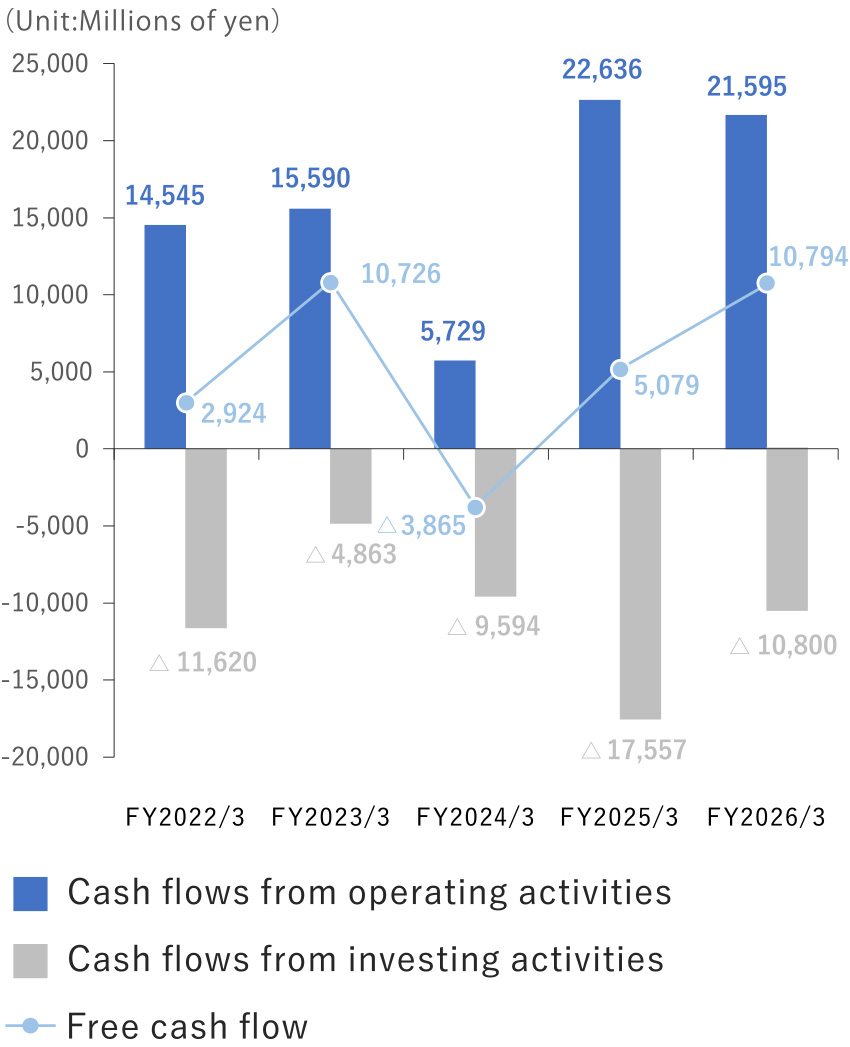
(Unit: Millions of yen)
| Category | FY 2022/3 | FY 2023/3 | FY 2024/3 | FY 2025/3 | FY 2026/3 |
|---|---|---|---|---|---|
| Cash flows from operating activities | 14,545 | 15,590 | 5,729 | 22,636 | 21,595 |
| Cash flows from investing activities | -11,620 | -4,863 | -9,594 | -17,557 | -10,800 |
| Free cash flow* | 2,924 | 10,726 | -3,865 | 5,079 | 10,794 |
| Cash flows from financing activities | -4,802 | -10,441 | 6,694 | -5,390 | -11,274 |
| Effect of exchange rate change on cash and cash equivalents | 523 | 301 | 873 | -433 | 753 |
| Net increase (decrease) in cash and cash equivalents | -1,355 | 586 | 3,702 | -744 | 273 |
| Cash and cash equivalents at beginning of period | 19,253 | 17,898 | 18,484 | 22,188 | 21,635 |
| Increase in cash and cash equivalents resulting from merger with non-consolidated subsidiaries | 0 | 0 | 0 | 191 | 0 |
| Cash and cash equivalents at end of period | 17,898 | 18,484 | 22,187 | 21,635 | 21,907 |
- *Free cash flow = Cash flows from operating activities + Cash flows from investing activities
